


Set the stage. No filler. The industry has hit an inflection point. Occupancy is climbing, supply is stuck, labor is still tight, and investors are circling. This isn’t a forecast. These are the signals on the ground right now backed by data, not headlines.
This is a trends article, not a tutorial. What changed. Why did it change? What it signals for the next 12 months. Then, a tight operator playbook you can act on tomorrow.
Executive Snapshot: The Senior Living Market in 60 Seconds

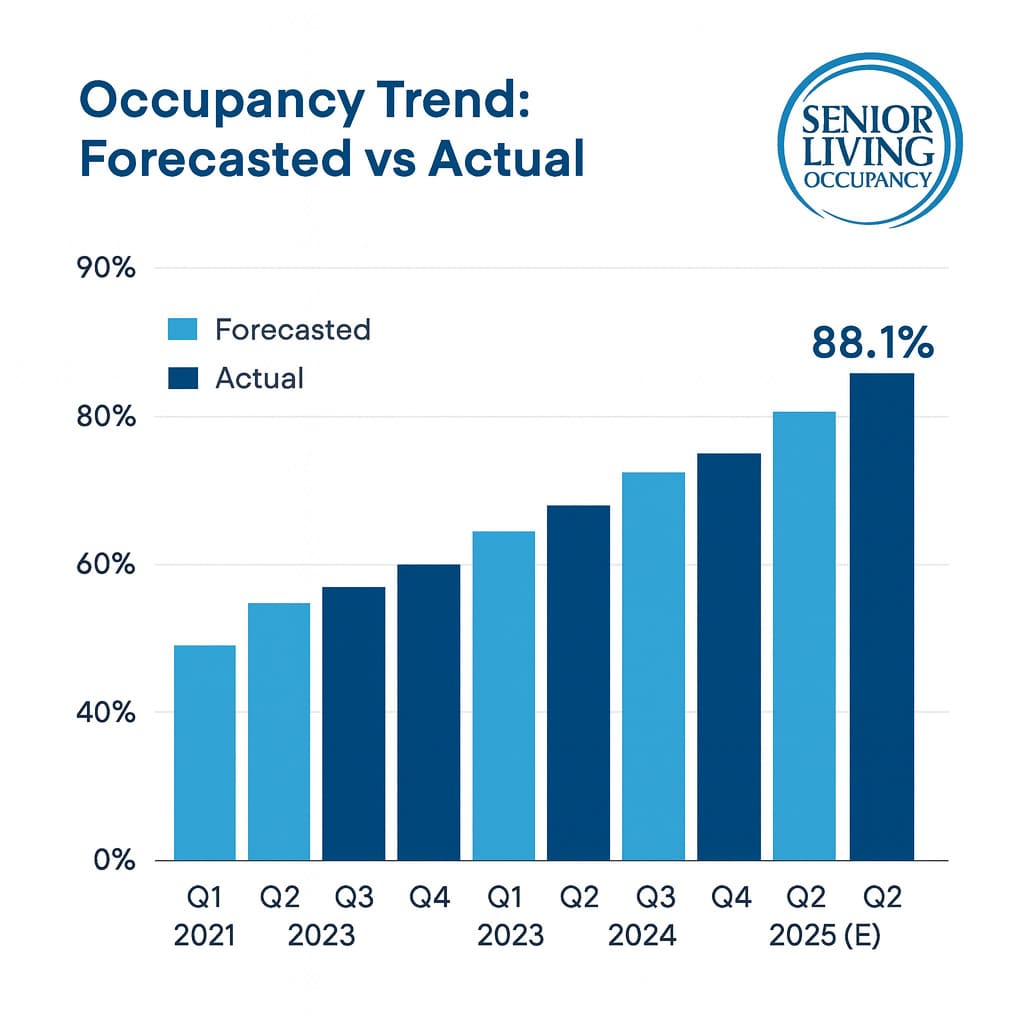
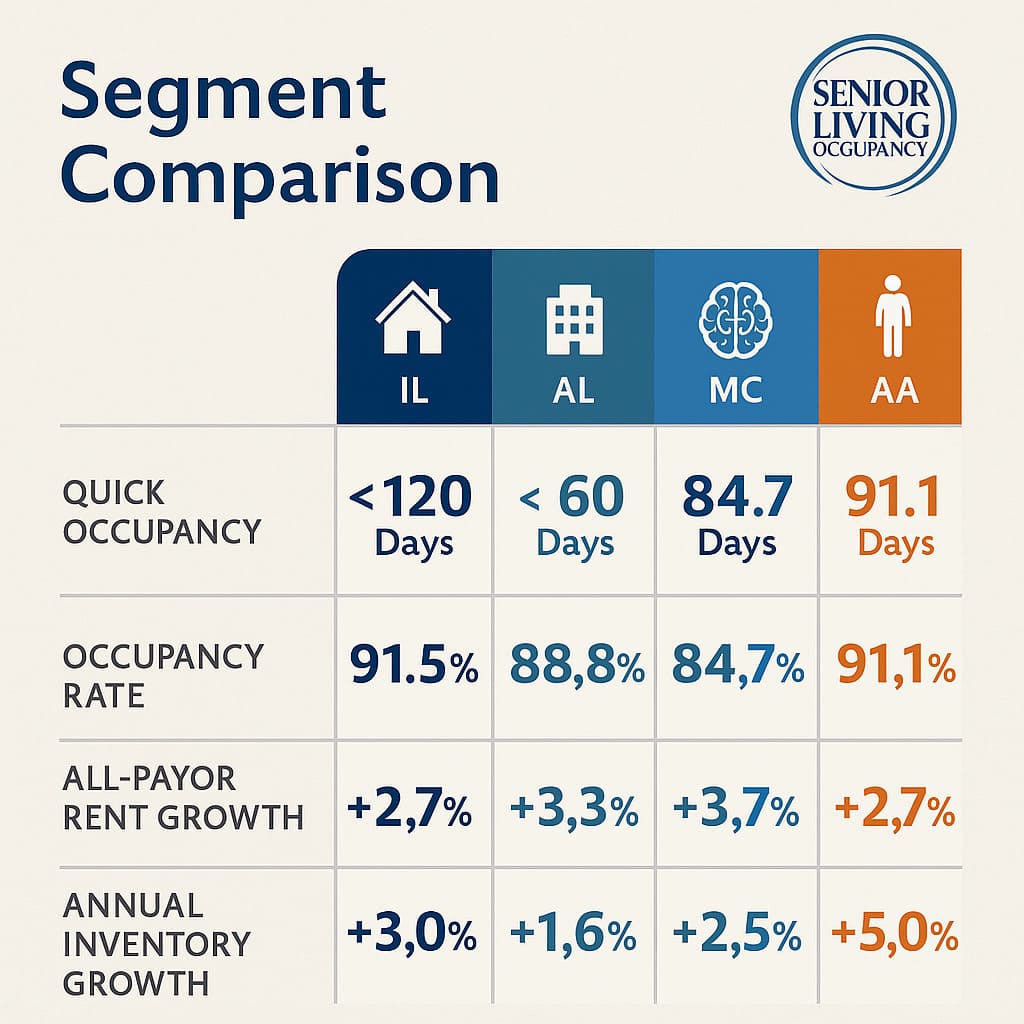
- Occupancy reached 88.1% in Q2 2025 across the 31 NIC MAP Primary Markets. Net absorption outpaced new deliveries again.(Source).
- Active Adult is running even tighter at 92.3% in Q2 2025. Lower cost and lifestyle appeal keep demand ahead of supply.(Source).
- Construction is at record lows while demand rises. Inventory growth remains muted as financing and costs suppress new starts.(Source).
- The recovery streak continued in Q2. It’s now the 16th straight quarterly improvement in sector occupancy to 88.1%.(Source).
- America is aging into senior housing. Older adults outnumber children in 11 states and in nearly half of U.S. counties, shifting local demand curves.(Source).
- Workforce pressure still caps throughput. Many care providers report limiting new admissions due to staffing shortages.(Source).
- Want a quick operator benchmark? See Argentum’s 2025 Largest Providers report for footprint and unit counts you can stack against.(Source).
The 2025 Dashboard
Start here.
Occupancy inched up again this quarter. 88.1% across NIC MAP’s 31 primary markets. That’s not just another stat. It’s the sixteenth straight quarterly gain , and the clearest signal yet that this isn’t a bounce. It’s a shift. Source: NIC MAP Vision Q2 2025.
And the real action isn’t in AL or MC. It’s IL.
Independent living occupancy rose 80 basis points last quarter, hitting nearly 89.7%. Families are moving earlier. Seniors are choosing lifestyle before care becomes the reason. Operators who used to think of IL as “pre-AL” are realizing it’s its own driver now. You can see it in how fast renovated IL units lease up , especially if they’ve got light, a balcony, and space for a pet.
Meanwhile, Active Adult housing is sitting at 92.3% occupancy. That’s not a typo. No care. No licensed staff. Just price, lifestyle, and community.
It’s what IL was 15 years ago , before the staffing rulebooks and margin constraints.
What’s driving this? Demand. Not from lead generation gimmicks, but from reality.
The U.S. Census confirmed older adults now outnumber kids in nearly half of U.S. counties. In 11 states, that tipping point is already behind us. This is no longer a future trend. It’s the present demographic shape of your market.
Source: U.S. Census Bureau, 2024
And yet , even with demand rising and units filling faster , construction hasn’t caught up.
Not even close.
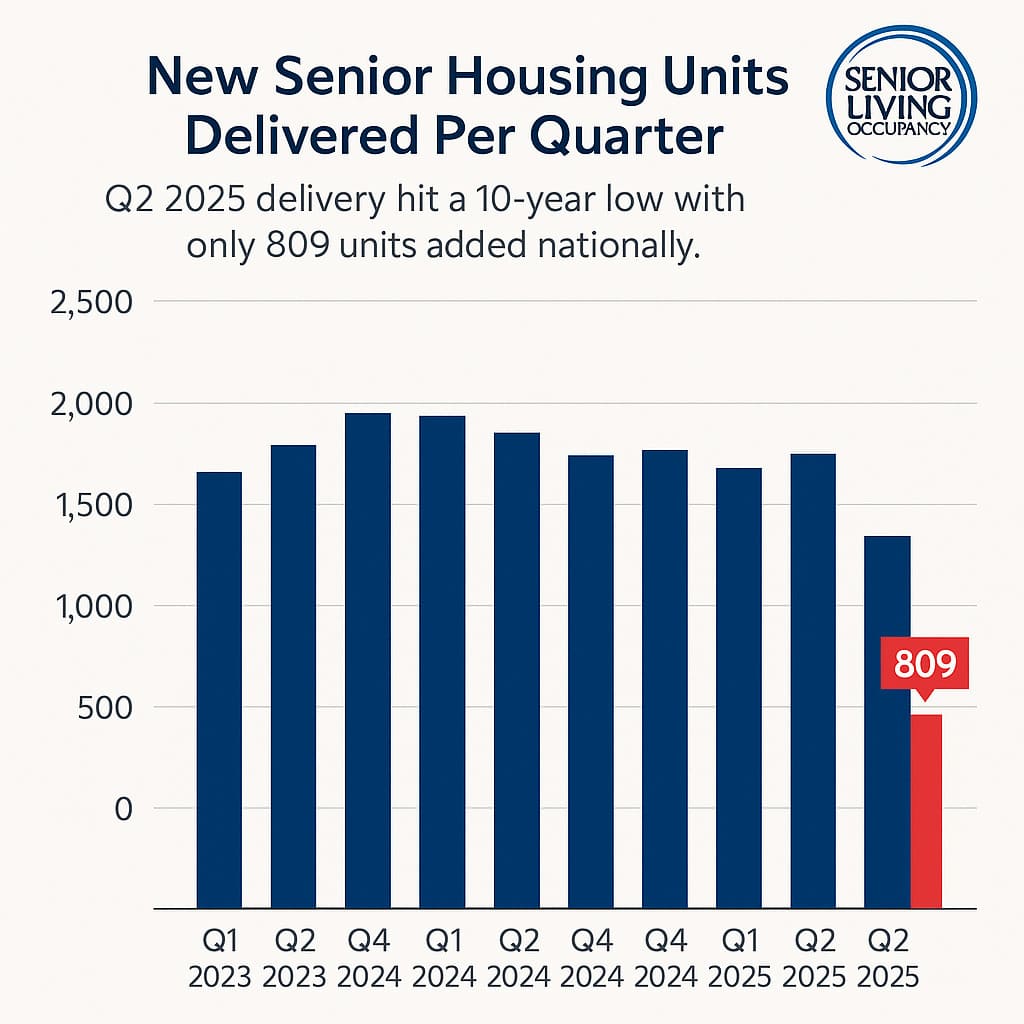
Only 809 new units were delivered across the country in Q2 2025. That’s an annualized growth rate of less than 1%. Developers are still sitting on the sidelines. Construction debt is expensive. Operating margins are thin. And no one wants to build unless they can stabilize in under 18 months.
For operators already in-market, that’s a gift.
Less new supply means better lease-up speed, stronger rate integrity, and less pressure to buy your leads back every 90 days.
But here’s the catch.
You can’t take advantage of any of this if you can’t staff.
Staffing is still the ceiling.
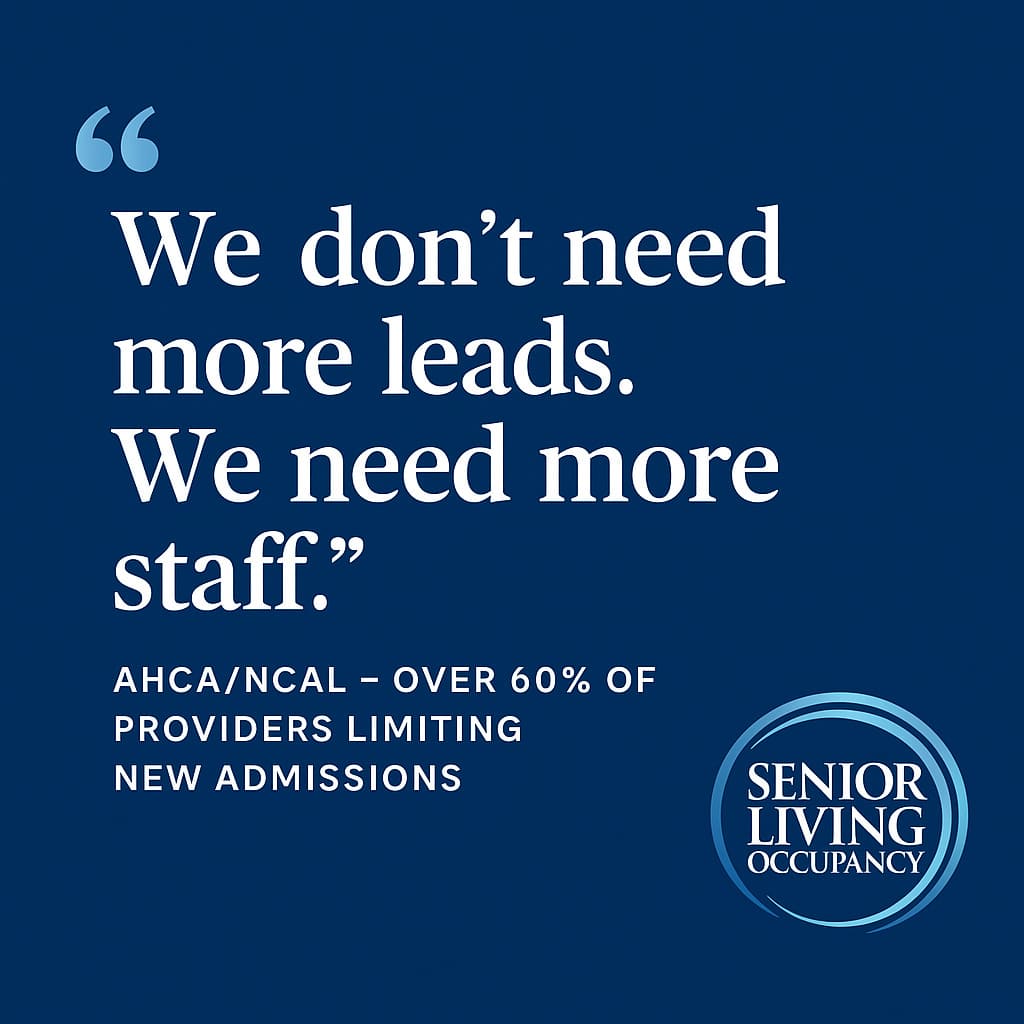
According to AHCA/NCAL, more than 60% of providers are limiting new admissions due to labor shortages. That means full waitlists… and empty rooms. Source: AHCA/NCAL Workforce Survey
This is the line nobody says out loud: demand isn’t the problem anymore. Throughput is.
It’s the rate at which you can turn units, staff shifts, onboard families, and reset care plans.
It’s the invisible KPI behind every occupancy report.
Until you solve for that, more leads don’t help you.
What’s working right now? Operators who build internal float pools, who pay a little more but offer a better schedule, who train smarter and stop chasing resumes that ghost.
That’s who’s growing , not just filling beds, but controlling the pace.
Demand Is the Easy Part
Everyone says the same thing right now: “We’ve got plenty of leads.”
And they’re probably right.
The 2025 demographic tailwind is real. The U.S. Census didn’t whisper it , they published it. Older adults now outnumber children in nearly half the country. In states like Maine, Vermont, and Florida, that’s not a prediction. That’s a 3-year-old reality. View the Census data
But demand doesn’t equal move-ins. And that’s where most operators are still stuck.
There are two big shifts happening under the surface.
First: the 80+ cohort is finally showing up
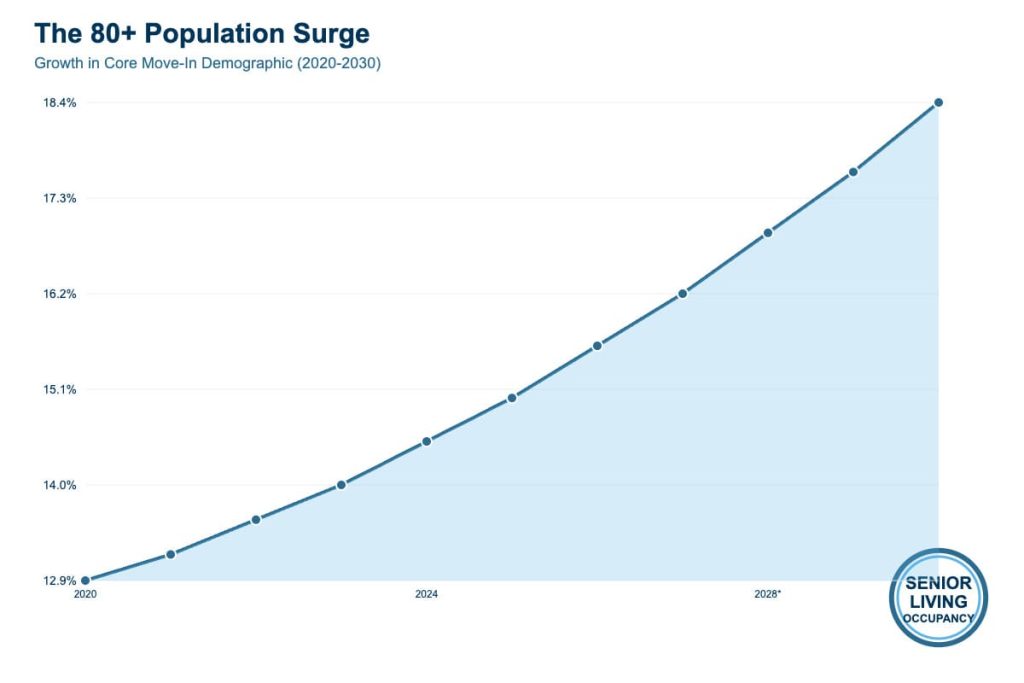
The 65+ number gets all the headlines. It looks impressive. But most of your core move-ins don’t come at 66. They come at 83, 84, 85.

And that group? It’s ballooning.
From 2020 to 2025, the 80+ population added more than 2 million people in the U.S. alone. That curve steepens every year through 2030. What that means: your natural buyer pool is growing whether you market or not.
If your inquiry volume is flat in 2025, you’re not just losing leads. You’re losing share.
The good news: Families are acting faster. They’re more aware. They’ve read the Google Reviews. They’ve already toured your competitor. When they call, they’re close.
The bad news: Expectations are higher. Everyone wants a hotel. No one wants “a facility.” And if your digital experience doesn’t meet the emotional tone of the family’s search, they bounce , no matter how strong the care is behind your walls.
Second: active adult is siphoning the early movers
You’ve probably felt this.
The 72-year-old who, three years ago, would’ve gone straight into IL?
Now she’s comparing you to a brand-new active adult rental community with wine tastings, pickleball, and a rent $900 lower.
Active adult occupancy hit 92.3% in Q2 2025, according to NIC MAP Vision. That’s not “doing well.” That’s nearly full.
See the Active Adult report
Operators in that segment aren’t chasing care licenses or managing staff ratios. They’re managing lifestyle. And in a post-pandemic world, that’s what older adults want back.
So what happens?
IL loses early movers. AL gets higher acuity. MC gets crisis calls. And unless you’ve built your marketing and sales funnel for that reality, your conversion rates start slipping.
Want a simple test?
Go look at your last 20 tours. How many were proactive, and how many were reactive?
If 70% came after a fall, a discharge, or a “we can’t manage this at home anymore,” then you’re already downstream. You’re not talking to the market , you’re talking to the leftovers.
That’s why demand isn’t the hard part.
Positioning is.
Because even in a market with rising age curves, rising interest, and rising occupancy , the gap between curiosity and conversion is growing wider.
And if you’re not adapting your messaging, your team will keep working harder just to stay flat.
Supply Is Where Things Get Stuck
You’ve probably heard someone on your team say it this year: “We could be full if we just had more rooms.”
And this time, they’re not exaggerating.
Here’s the uncomfortable truth most operators are now facing:
Demand is not your limiter. Inventory is.
Let’s look at what’s actually happening.
In Q2 2025, just 809 new senior housing units came online across the 31 NIC MAP Primary Markets. That’s not per market. That’s total. Source: NIC MAP Vision

That number is so low it’s hard to process. For context, that’s the smallest quarterly delivery total in over a decade.
And it’s not a one-off.
The current construction pipeline is less than 20,000 units nationwide. That’s across IL, AL, MC, and everything in between. We’re running at a build rate that’s barely keeping up with depreciation, let alone new demand.
Why?
Because no one wants to build in this environment.
Interest rates are high. Construction costs haven’t dropped. Lease-up timelines have stretched post-COVID. And even if you get to 85% stabilized, good luck selling without heavy concessions or longer hold periods.
So what happens?
The math kills the project before the first shovel hits the ground.
The result: frozen inventory, rising inquiries
You feel it in the weirdest places.
- Two-bedroom IL units with waitlists a year out
- MC rooms that lease in 48 hours without digital ads
- Sales directors saying, “We’re turning away move-ins” while the website still has CTAs live
This is not a sales problem. It’s a space problem.
And here’s where it gets more real: the buildings that already exist can’t even fully use their space.
Why?
Staffing.
According to AHCA and NCAL, more than 60% of long-term care providers report limiting new admissions due to workforce shortages.
See the survey findings
So now you’re not just constrained by construction. You’re constrained by team bandwidth.
- You’ve got rooms but not the med techs to support them
- You’ve got leads but not the RN to clear the care plan
- You’ve got families waiting, while census holds flat
This is the reality for 2025: your bottleneck isn’t Google Ads. It’s unit readiness and staffing ratios.
The operators who win now don’t wait on buildings
They turn what they already have , faster, smarter, and tighter.
- 5-day make-readies, not 12
- Ongoing pre-leasing pipelines, not “who’s calling this week”
- Shadow waitlists with real communication, not a spreadsheet nobody updates
In 2018, you could solve slow fill-up with a flyer and a food truck. In 2025, you solve it by managing throughput like revenue.
That’s not a marketing plan. That’s a capacity strategy.
And in a market where no one is building, capacity is everything.
Labor Is Still the Choke Point
Let’s stop pretending.
You can’t take more residents if you don’t have the team to care for them. It doesn’t matter how many leads marketing generates. If you’re short on med techs, aides, or nurses , your growth stops at the scheduler’s desk.
And that’s exactly what’s happening.
According to the AHCA/NCAL 2024 staffing survey, over 60% of long-term care providers are limiting new admissions due to workforce shortages.

Let’s put that in plain language: More than half of the industry has demand… and still can’t grow.
You feel it everywhere
- The weekend shift nobody wants
- The call-off that blows up three other people’s schedules
- The open role that’s been posted since April with zero qualified applicants
And worse , your occupancy goals depend on these phantom hires.
So you scramble. You overpay. You plug holes with agency. Then you watch margins erode while your full-time team burns out.
The CFO hates it. The ops lead dreads it. But no one can make the problem go away.
Except… some operators actually are.
So what’s working?
Not job boards. Not “flexible culture” taglines. And definitely not just raising base pay.
Here’s what’s showing up again and again in buildings that are actually growing:
1. Shift ownership
Give staff the ability to set preferred shifts months in advance , and honor it. That alone cuts call-offs. No surprise: people show up when they feel control.
2. Float pools
Internal float pools across 2–3 sister properties give you backup without agency costs. It’s more paperwork, yes. But it’s cheaper than 70 bucks an hour for someone who doesn’t know your residents’ names.
3. Pay for reliability, not overtime
Some groups are offering $200/month bonuses for perfect attendance , and it’s working better than hourly bumps. Why? Because it rewards the people who already show up.
4. Build real training, not check-the-box onboarding
Operators who invest 20+ hours in new-hire shadowing are seeing retention jump by 30% or more. The training isn’t fancy. It’s real. And it helps new staff actually stay.
Labor isn’t a cost problem. It’s a capacity strategy.
Here’s the shift: Operators who treat labor like a financial line item are stuck. Operators who treat labor like throughput infrastructure are growing.
In other words, the buildings that are full in 2025 aren’t always the ones with the best marketing.
They’re the ones who can open rooms faster, turn them without drama, and deliver care without burning their teams out.
It’s not flashy. But it scales.
What’s Moving , and What’s Not: A Segment Breakdown
Independent Living (IL)
Occupancy is rising faster than AL in many markets , up nearly 90 basis points last quarter. And it’s not coming from heavier care residents. It’s coming from earlier movers.
Seniors who don’t want to wait for a crisis. Adult children who want peace of mind before the fall.
The shift, IL is no longer just a “holding pattern” before AL. It’s becoming its own decision , proactive, lifestyle-driven, and competitive with Active Adult.
Operators leaning into hospitality , not care , are the ones winning here. Think:
- Concierge-style entry experience
- High-touch tours with lifestyle framing
- Upsells on premium units and flexible meal plans
IL doesn’t need a higher close rate. It needs a higher positioning.
Assisted Living (AL)
AL is recovering. But the margins are tighter, the labor pressure is heavier, and the acuity is higher.
Families aren’t waiting until they “maybe need help.” They’re calling after the fall. After the discharge. After the panic.
So the conversion path is shorter , and more fragile.
If your sales team still treats AL like IL , long consultative calls, slow follow-up, long waitlists, you’re going to miss the window.
What’s working now:
- Tight response times (minutes, not hours)
- Tour availability in the next 24–48 hours
- Coordination with discharge planners and SNF liaisons
- On-site clinical backup during tours for care questions
Bottom line: AL is still a strong performer in 2025 , but only if ops and sales are in lockstep.
Memory Care (MC)
MC isn’t growing fast. But it’s not going away.
The inventory is limited. The demand is steady. And the decision is urgent.
Here, it’s not about channels. It’s about confidence.
Families don’t need 17 amenities. They need to feel , instantly , that their parent will be safe, seen, and known.
The operators doing best in MC right now:
- Offer coaching calls with the adult child before the tour
- Walk through a sample day with clarity, not vagueness
- Share one story that proves your staff knows how to de-escalate
If your MC lead funnel looks like your AL funnel, fix it. This is a trust-based sale, not a brochure sale.
Active Adult
Let’s be real: Active Adult is eating IL’s lunch.
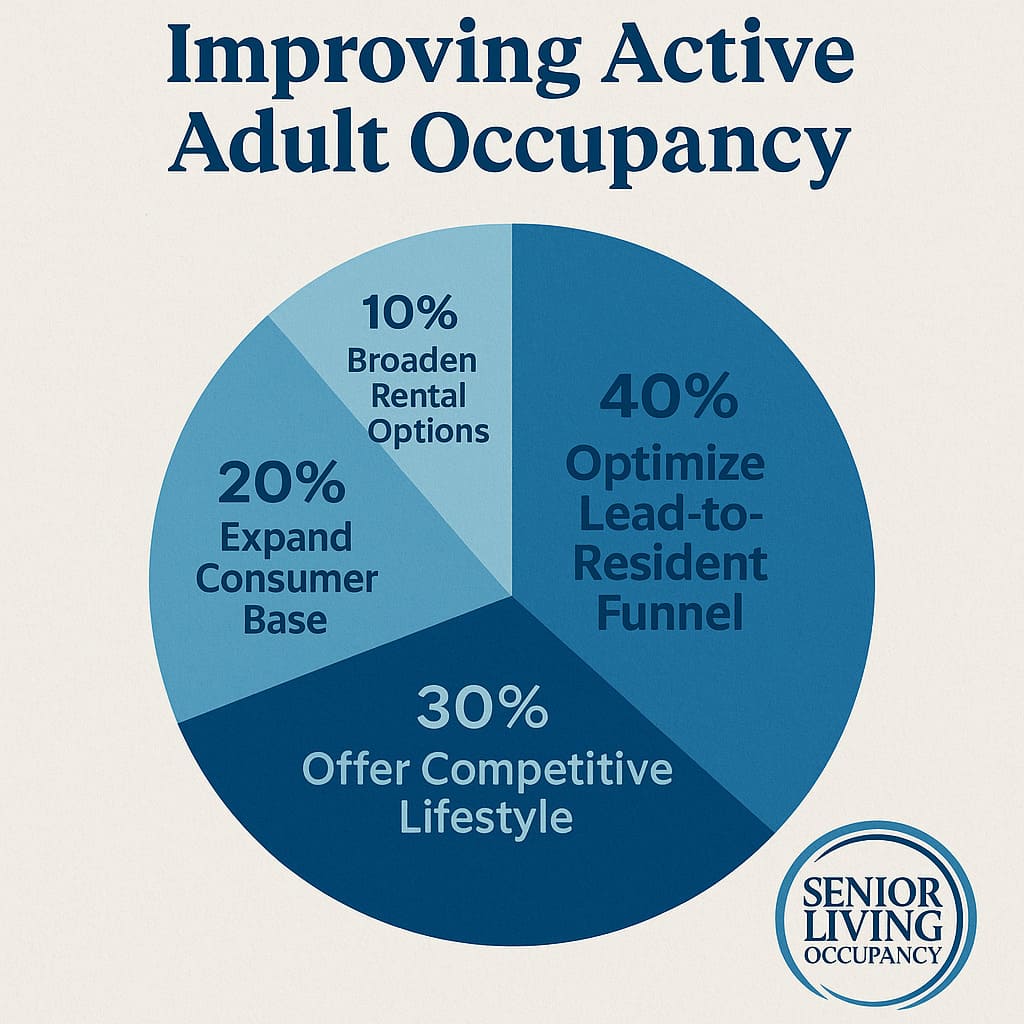
Occupancy is over 92%, and in some markets, it’s outperforming multifamily. Source: NIC Active Adult Trends
The playbook here is radically different:
- No care services
- Simpler staffing models
- Lower price point
- More lifestyle-driven move-ins
What this means for you depends on your role.
- If you run IL/AL: You’re now competing earlier. Build brand awareness at the pre-care stage.
- If you run Active Adult: Raise rates carefully. Inventory is tight, but don’t overreach.
- If you invest: Look for Active Adult portfolios with low turnover and long lease terms , they’re appreciating faster than traditional IL.
Bottom line: Active Adult isn’t a sideshow anymore. It’s a standalone category , and in 2025, it’s the strongest performing one on paper.
The Regional Watchlist: Where the Market’s Moving Fastest
Not all markets are equal right now.
Some are seeing lease-ups that used to take 12 months finish in six. Others are sitting flat, even with decent demand. The difference? Demographics, local construction pipelines, and policy.
Here’s where things are shifting , and why it matters.
The Sun Belt Is Still Winning… But It’s Not Automatic Anymore
Yes, Texas, Arizona, Florida, Georgia , they’re still driving most of the volume. But the “build it and they will come” playbook is over.
In places like Phoenix and Austin, there’s real demand , but also inventory drag. Some neighborhoods are overbuilt. Some buildings are chasing the same 500 leads. New projects opening today are finding that rates aren’t climbing as fast as spreadsheets said they would in 2022.
That said, if you’ve already stabilized in these markets, you’re in a great spot. With new development slowing, your only real competition is the next lease-up… and that might be 18 months out.
The Midwest Is Quietly Gaining Ground
Markets like Indianapolis, Columbus, and Kansas City are seeing strong net absorption with fewer new builds. Why?
- The 80+ population is growing
- Real estate is cheaper
- Construction is slower
- And care-seeking behavior is more values-driven than coastal markets
Operators with clean buildings and consistent staffing are outperforming here , not because they have the best ads, but because they answer the phone and follow up.
If you’re sitting on older assets in these areas, now is the time to renovate and reprice. With so few competitors adding supply, even a light CapEx can unlock 10–15% rent growth over 12 months.
California, New York, and New Jersey: Expensive and Complicated
In these states, even if you have the demand… everything else is hard.
- Labor costs are brutal
- Licensing is slow
- Building conversions get caught in red tape
- And lease-up timelines are harder to predict
That doesn’t mean don’t play here. It means you need real operational depth to make it pencil. These are not good markets for first-timers or “value-add” optimists. They reward specialists , operators who understand local nuance and know how to build staff loyalty in high-cost ZIP codes.
The Hidden Movers: Mountain West and Southeast
Keep an eye on states like Utah, Idaho, and the Carolinas.
These are markets where:
- The 65+ cohort is growing fast
- Home prices have outpaced retirement incomes
- And more people are aging without family support nearby
That’s a demand cocktail that leads to higher acuity move-ins and longer stays. Some operators are reporting lower sales cycles and higher average rents in these metros than their coastal comparables.
It’s not about volume. It’s about efficiency. And for the right operator, these markets give you both.
The 12-Month Operator Playbook
This isn’t about goals. It’s about execution.
In a market where demand is strong, supply is stuck, and labor is the real bottleneck , the winners are not the ones with the flashiest websites.
They’re the ones running tighter systems behind the scenes.
Here’s what we’re seeing work, right now, across the best-performing communities.
1. Turn Units Like It’s Your Growth Engine , Because It Is
Forget the 14-day turnover cycle. The best buildings are flipping units in 5 to 7 days , not by working harder, but by working smarter.
What they’re doing:
- Pre-staging basic room setups while the resident is still in move-out
- Using standardized make-ready checklists to reduce back-and-forth
- Keeping a floating maintenance tech to speed up punch lists
Every day a unit sits empty is money burned. If you want to grow, treat make-ready time like revenue, not housekeeping.
2. Stop Chasing Leads. Start Warming Waitlists.
You don’t need 30 leads a week if you can’t move 5 of them in.
Instead of dumping money into more traffic, focus on nurturing the interest you already have.
Operators winning in this market:
- Have shadow waitlists built from tours that weren’t ready… yet
- Send real, personalized updates on availability , not email blasts
- Keep relationships alive with check-ins that don’t sell anything
In a supply-constrained market, the fastest mover wins. Warm leads close faster than cold ones , always.
3. Price Like You Mean It , Or You’ll Leave Money on the Table
Here’s what’s happening: demand is up, supply is stuck, but most communities are still using last year’s pricing logic.
If your units are full and you’re not raising rents on turnover, you’re not in the market , you’re behind it.
The smart pricing moves we’re seeing:
- Floor-specific pricing (yes, floor 3 should cost more than floor 1)
- View-based premiums, even if it’s just trees and not parking lot
- Quarterly market checks, not annual pricing audits
You don’t have to price gouge. You just have to be smarter than the spreadsheet you made in 2021.
4. Build a Labor Pipeline, Not Just a Job Board
Everyone says labor is their biggest challenge. Few are treating it like a recruiting system.
The operators seeing real wins are doing things differently:
- Partnering with local CNA programs for early pipeline access
- Offering referral bonuses to residents and families , not just staff
- Running internal leadership tracks for med techs and aides
Hiring reactively doesn’t work in this market. You need to treat staffing like occupancy , something you build ahead of the curve.
5. Sync Sales and Ops Daily, Not Monthly
Too many buildings let friction build up between the team that brings people in and the team that keeps them happy.
That’s a guaranteed way to stall growth.
High-performing teams are:
- Running daily 10-minute standups between sales and EDs
- Sharing shift gaps with the sales team so tours are aligned with staff reality
- Giving sales real visibility into clinical flags that affect move-in timing
This isn’t micromanagement. It’s clarity. And it removes the internal bottlenecks that keep census flat when it should be rising.
Bottom line: You don’t need a 12-month marketing plan. You need a 12-week operating sprint that your entire team can execute.
In this market, growth comes from speed, systems, and sharp coordination , not just more leads.
2025–2026 Outlook: What Operators Should Do Now
Let’s get tactical.
This isn’t about big strategy decks. This is about what you adjust this quarter to stay ahead , and what you start building toward for next year.
We’ll break it down into four plays.
Pricing & Revenue Management in a Tight Supply Market
You’re not in a soft market anymore.
Occupancy is rising. Construction is frozen. Families are moving sooner. That means your pricing isn’t just a finance decision , it’s your biggest growth lever.
Here’s what high-performing teams are already doing:
- Reviewing rent comps monthly, not annually
- Tiering prices by floor, view, and distance to elevators
- Bundling services in ways that simplify the sale and raise total contract value
- Raising renewal rates on stabilized units by 5–10% when waitlists justify it
If you’re still using a flat “unit type” price sheet across the board, you’re undercharging. And in this market, undercharging is the same thing as shrinking margins.
Staffing Playbook: Pipeline, Retention, Scheduling
If your org doesn’t have a hiring system, you’re going to feel it harder in Q1.
Operators building labor resilience right now are:
- Partnering with CNA training programs before students graduate
- Offering referral bonuses that trigger after 90 days, not day one
- Promoting from within to fill middle-management gaps
- Giving frontline staff more control over their schedule, not just more hours
Scheduling flexibility doesn’t mean chaos. It means people show up because they weren’t blindsided. That one change has done more for retention in 2025 than any hourly raise.
Marketing Mix Shifts: Know Your Audience
Here’s the problem: most operators are using one marketing strategy to chase three completely different personas.
The 72-year-old active adult renter isn’t the same as the 84-year-old daughter-led IL move-in , and neither of them responds to the same ad, CTA, or sales script as an AL crisis-care family.
Your playbook should look more like this:
- Active Adult: Show lifestyle, not care. Think 55+ apartment with freedom.
- IL: Lead with independence, back it with hospitality.
- AL: Emphasize safety, speed, and emotional support.
- MC: Lead with trust. Real photos. Real staff. No jargon.
If your homepage or ad creative is still trying to be everything to everyone, you’re losing relevance , and wasting budget.
Development & Expansion Timing: When the Math Works Again
We’re in a holding pattern.
New development has slowed for a reason: it’s hard to make the numbers pencil. But that won’t last forever.
If you’ve got land, capital, or access to a JV , here’s when expansion might start making sense again:
- Interest rates cool (watch mid-2026 forecasts)
- Build costs stabilize (especially modular or wood-frame)
- Occupancy stays tight (and it likely will)
- You have a defined pipeline of prequalified, pre-leased demand
Until then, expand your operating margin , not your footprint.
Stabilize faster. Turn units faster. Fill your buildings faster.
Then look at what you could replicate , not what you can gamble.
Methodology & Definitions
Everything in this article is based on publicly available, verifiable data from trusted industry sources , not summaries of summaries or recycled content.
The core data sources include:
- NIC MAP Vision , Occupancy, absorption, construction starts, active adult trends
- U.S. Census Bureau , 65+ and 80+ demographic trends
- AHCA/NCAL , Workforce surveys, staffing shortages, admission limitations
- Argentum , Largest providers report, industry forecasts
- Senior Housing News , Q2/Q3 coverage of absorption, unit delivery, and market shifts
We also included operator perspectives from interviews, investor notes, and live reporting across trade publications to add real-world depth behind the numbers.
Key Definitions
- Independent Living (IL): Non-licensed senior housing with minimal care; focused on lifestyle, meals, and community.
- Assisted Living (AL): Licensed setting offering support with daily activities (ADLs), such as bathing, dressing, and medication management.
- Memory Care (MC): Secure, structured environments for individuals with Alzheimer’s or other forms of dementia; typically bundled with AL or standalone.
- Active Adult: 55+ rental communities with no care services; lifestyle-focused with amenities like fitness centers, pools, and community events.
- Occupancy: The percentage of available units that are currently rented and occupied. Not to be confused with licensed capacity in care settings.
- Absorption: Net gain in occupied units during a given time period (e.g. quarter); key metric for demand health.
- Primary Markets: Defined by NIC MAP as 31 major U.S. metro areas that provide consistent, high-quality data on senior housing trends.
You can find a full glossary of NIC MAP terms here on their site.
Sources
Every stat, quote, and trend in this article is backed by primary research and trusted data. Here’s exactly where each piece came from:
- NIC MAP Vision – Q2 2025 Occupancy & Construction Data
NIC MAP Data Release: Q2 2025 - NIC Active Adult Market Insights (2025)
Active Adult Snapshot - NIC Construction & Inventory Trends
NIC Insight Reports - U.S. Census Bureau – Aging Population Reports
Older Adults Population Growth - AHCA/NCAL – 2024 Long-Term Care Workforce Survey
Staffing Crisis Survey Summary - Argentum – 2025 Largest Providers Report
Argentum Industry Reports - Senior Housing News – Market Coverage
Q2 2025 Industry Recap - U.S. Census – Population Projections & County-Level Data
U.S. Aging Map
All sources were reviewed and live as of October 2025.
FAQ: Senior Care Industry Questions in 2025
What is the current occupancy rate for senior housing in 2025?
As of Q2 2025, occupancy across the 31 primary markets tracked by NIC MAP Vision hit 88.1% , the sixteenth consecutive quarterly increase.
View the NIC report
This growth is driven by a combination of rising demand from the 80+ population and a slowdown in new construction.
Is senior living demand outpacing supply in 2025?
Yes , demand is clearly ahead of new supply.
In Q2 2025, only 809 new units were delivered across all tracked markets, while net absorption (move-ins) exceeded that figure. This marks the lowest quarterly inventory growth in over a decade. Read NIC construction trends
Occupancy continues to rise, waitlists are reappearing, and developers remain cautious about new builds due to cost pressures and capital constraints.
How big is the assisted living market in 2025?
According to a 2025 market estimate by Grand View Research, the U.S. assisted living facility market is valued at approximately $91.8 billion and is projected to grow at a CAGR of 5.5% through 2030.
Note: This is a commercial research estimate , actual transaction data may vary based on region and asset type.
Where are staffing shortages most severe in the senior care industry?
The AHCA/NCAL 2024 workforce survey shows that over 60% of long-term care providers report limiting admissions due to staffing shortages.
Shortages are most acute in:
- Skilled nursing facilities
- Memory care communities with 24/7 coverage
- States with high cost of living and regulatory complexity (e.g. California, New York)
Final Thoughts: A Market That Rewards Precision
The numbers are clear.
Occupancy is up. Construction is down. Labor is still the limiter. And demand? It’s no longer a future trend. It’s already here , across IL, AL, MC, and especially Active Adult.
If you’re running a community, this isn’t the time for guesswork. It’s the time to get sharper.
Faster unit turns. Smarter pricing. Tighter labor pipelines. Better alignment between your marketing and your actual capacity.
Because in 2025, the communities that win aren’t the ones with the most ads. They’re the ones that operate like growth is their default setting.
